Inside our June 2026 reference range update: how we standardize results across scanners, classify key measures and explain differences from your clinic PDF.
If you have had a DEXA body composition scan through NiaHealth, you may have noticed something puzzling. The PDF report from the clinic says one thing about your body fat, your visceral fat or your muscle mass. Your NiaHealth dashboard says something slightly different.
That is not a mistake, and it is not a rounding error. It is the result of a deliberate decision: every DEXA result that comes into NiaHealth is processed the same way, using the same formulas and compared against the same reference population, regardless of which clinic you went to or which machine scanned you. This article explains why that matters, what we actually do to your numbers, and where the limits of that work are.
What a DEXA scan measures
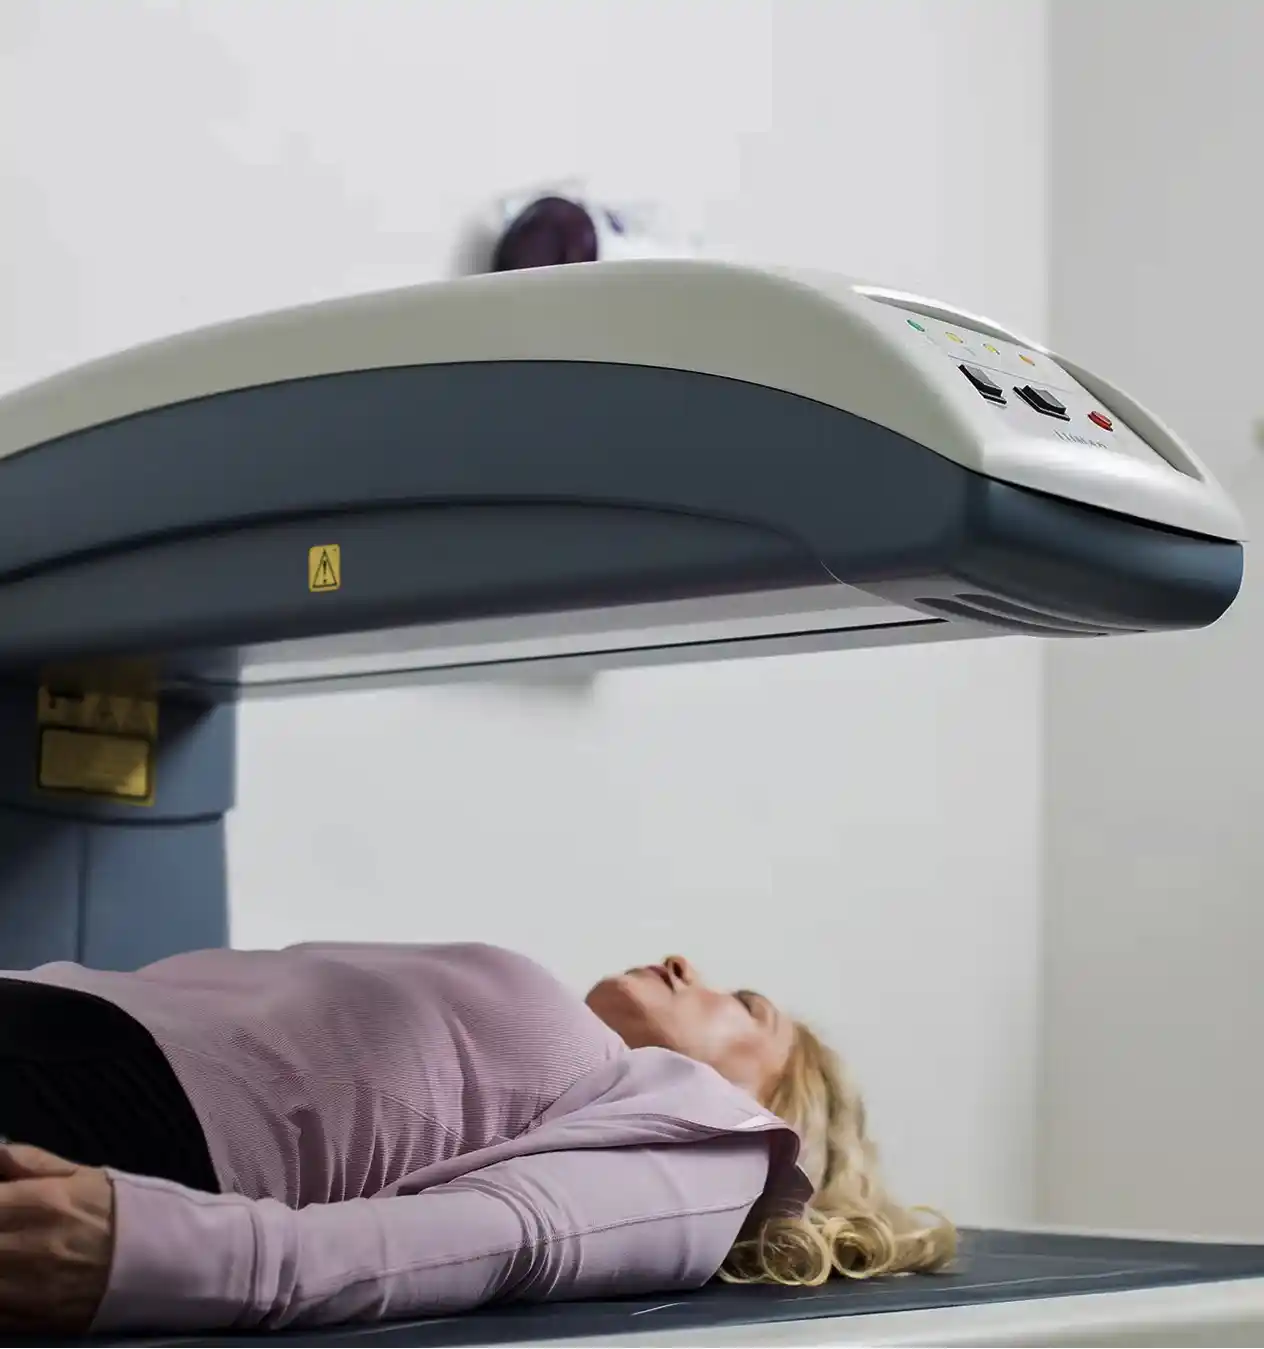
DEXA (dual-energy X-ray absorptiometry, sometimes written DXA) passes very low-dose X-rays at two different energy levels through the body. Bone, lean tissue and fat absorb those energies differently, so the scanner can estimate how much of each is present in every region of the body. From those estimates it reports the numbers you see on your PDF: total fat mass, lean mass, bone mineral content and density, and derived values such as body fat percentage, visceral adipose tissue (VAT) and appendicular lean mass index (ALMI).
The word estimate is important. A DEXA scan does not weigh your fat directly. It measures how X-rays are attenuated and then runs that measurement through the manufacturer's software, which uses its own assumptions, its own calibration and its own definitions of regions like the "android" zone where visceral fat is estimated. Two scanners can be looking at the same body and produce different numbers because the math behind them is different.
Two families of machines
Almost every clinical DEXA scanner in Canada comes from one of two manufacturers: GE Lunar or Hologic. They are both excellent, well-validated machines. They also do not agree with each other and depending on the software they are running, may not agree with machines from the same manufacturer.
Published head-to-head comparisons, where the same people are scanned on both systems on the same day, consistently find systematic differences [1][2][3]:
- Body fat percentage can differ by a few percentage points between manufacturers, partly because of calibration and partly because of how the percentage is calculated (more on this below).
- Visceral fat (VAT) is estimated with different algorithms and different regions of interest. Hologic and GE Lunar VAT numbers are not interchangeable without a conversion, and researchers have published cross-calibration equations specifically to move between them [3].
- Lean mass in the arms and legs also differs. In the published comparisons, Hologic systems tend to report somewhat less appendicular lean mass than GE Lunar systems for the same person [1][2].
For a single person tracking themselves on one machine over time, none of this matters much; the machine is consistent with itself. It matters a great deal when you want to compare a member in Victoria scanned on a Hologic to a member in Toronto scanned on a GE Lunar, or when you want to tell either of them where they sit relative to a published reference population that was itself measured on one particular type of scanner.
Our providers and the machines they use
NiaHealth does not own DEXA scanners. We partner with clinics across Canada, and those clinics have made their own equipment choices. This is what our members are currently scanned on (accurate as of Sept. 30, 2026):
| Location | Manufacturer |
|---|---|
| Toronto, ON | GE Lunar |
| Edmonton, AB | GE Lunar |
| Calgary, AB | GE Lunar |
| Victoria and Vancouver, BC | Hologic |
| Vancouver, BC | Hologic |
Beyond the manufacturer, the clinics also differ in other details that change the numbers: whether the report is printed in metric or imperial units, whether VAT is reported as an area (cm²), a volume or a mass (grams), and, in the case of Hologic machines, which calibration mode the software is set to. We return to that last point below because it is the single largest source of the "my PDF says something different" question.
What we standardize, metric by metric
When your PDF is uploaded, we extract the raw measurements (fat mass, total mass, limb lean mass, VAT area, bone density scores and so on) rather than the interpreted percentages and categories the clinic software prints. We then apply the same set of calculations to everyone. Here is what that means for each number on your Body Composition page.
Body fat percentage
This is where most members first notice a difference, and it comes from two separate issues.
1. The formula. Body fat percentage sounds like it should have one definition, but it does not. Hologic software calculates it as fat mass divided by total mass, where total mass includes fat, lean soft tissue and bone mineral. GE Lunar software, by default, calculates fat mass divided by soft tissue mass only, which leaves bone out of the denominator. Because bone is excluded, the GE Lunar number is a little higher for the same body, typically by around one percentage point.
We use the total-mass version for everyone:
Body fat % = fat mass ÷ (fat mass + lean soft tissue + bone mineral content) × 100
We chose it because it describes the proportion of your actual body weight that is fat, and because it is the more conservative of the two. If you were scanned on a GE Lunar machine, the body fat percentage on your NiaHealth dashboard will therefore be slightly lower than the one on your PDF. Your fat mass in kilograms is identical; only the percentage calculation has changed.
2. Calibration mode (Hologic only). Until around 2020, Hologic scanners applied an adjustment called the "NHANES BCA calibration" to their results. It moves 5.4% of the measured lean soft tissue mass over to fat mass, which inflates fat mass by roughly 2.4 kg for a typical adult and adds two to three percentage points to body fat. Hologic has since moved away from this adjustment (the unadjusted output is called "Classic" calibration), but individual clinics can still have it switched on.
One of our providers, with locations in Victoria and Vancouver, currently reports with the NHANES BCA adjustment on. Rather than show you an inflated number, we reverse the adjustment mathematically to recover the underlying Classic fat mass before we calculate body fat percentage. If you were scanned there, this is why your dashboard body fat percentage (and fat mass in kilograms) can be noticeably lower than your PDF. We have also asked that clinic to switch their reporting to Classic calibration so the two numbers converge at the source. The same adjustment also lowers reported lean mass by a similar amount; we do not currently correct lean mass or ALMI for it (see the ALMI section below).
How we classify it. We use two categories. For men, under 22% body fat is "optimal" and 22% or higher is "at-risk." For women, under 32% is "optimal" and 32% or higher is "at-risk."
We chose these cutoffs because two separate sources of evidence point to the same range. First, a large meta-analysis (a study that pools results from many studies) looked at body fat and risk of death from any cause. It found that risk starts to climb above roughly 22% body fat in men and 35% in women [4]. Second, the American Association of Clinical Endocrinology's 2025 obesity algorithm uses 25% for men and 32% for women as the point where body fat may signal disease linked to excess fat tissue [5]. Our cutoffs sit where these two lines of evidence overlap.
We do not flag low body fat as at-risk. That's because genetic studies (using a method called Mendelian randomization) do not show that having low fat mass actually causes a higher risk of death. Low body fat can appear alongside higher mortality in some studies, but the genetic evidence suggests it isn't the cause.
One important caveat: after age 60, the link between body fat percentage and mortality becomes less consistent. So for older members, this number should not be read on its own. It should be looked at together with visceral fat (VAT, the fat stored around the organs), muscle mass, and metabolic bloodwork.
Visceral adipose tissue (VAT)
VAT is the fat packed around your abdominal organs. It behaves very differently from the fat under your skin, and it is one of the strongest modifiable predictors of cardiometabolic disease we can measure. It is also one of the numbers that varies most between scanners, so it gets the most processing.
Units. Different reports give VAT as an area (cm² or in²), a volume (cm³) or a mass (grams or pounds). We convert everything to a single unit, area in cm², because that is the unit the reference data and clinical thresholds are published in. One of our Edmonton clinics, for example, prints VAT in square inches on some reports; we convert it (1 in² = 6.4516 cm²).
Manufacturer. Hologic and GE Lunar estimate VAT using different algorithms and slightly different regions of the abdomen, and the two are not directly comparable. We convert Hologic VAT to its GE Lunar equivalent using the cross-calibration equation published by Bennett and colleagues in 2023 [3], who scanned 114 adults aged 18 to 81 on both systems specifically to derive it, then validated it in a separate group:
VAT (GE Lunar cm²) = VAT (Hologic cm²) × 1.337 − 24.8
If you were scanned in Victoria or Vancouver, the VAT on your dashboard is this converted value, not the raw number on your PDF. We do it so that the same at-risk thresholds and the same percentile comparison can be applied to everyone. It is worth being clear about what a cross-calibration equation can and cannot do. The two systems' VAT measures were very highly correlated in that study (r² = 0.97) and the equation removes the systematic difference between them, so groups of Hologic and GE Lunar results become comparable. The converted value will be close for most people, but it may place some people in a different risk category than the original scan would, especially when the result is close to a cutoff between categories.
How we classify it. We use a hybrid approach. The at-risk threshold is an absolute cutoff, above 100 cm² for males and above 90 cm² for females, because these are the most consistently replicated values across independent cohorts (mostly CT-based, with DEXA data clustering around similar numbers) for the point at which cardiometabolic risk factors start to accumulate. Women's threshold is set lower because meta-analyses show the risk threshold sits 10 to 20 cm² lower in females. We deliberately did not use percentiles alone for this, because in younger adults even a very high VAT percentile may still be below the level associated with disease, so percentiles would over-flag young members.
The optimal threshold, on the other hand, is population-based: below the 25th percentile of a reference cohort for your age and sex, meaning your VAT is lower than 75% of your peers. Anything between the optimal and at-risk thresholds falls in the normal band.
For members aged 60 and over there is no normal band, only optimal (at or below the at-risk cutoff) and at-risk. Two things drove that. First, the evidence that "lower is always better" for VAT is inconclusive in older adults; the link between VAT and mortality weakens considerably after 60. Second, VAT rises with age in every population studied, and by the 60s the 25th percentile for men in the reference cohort sits at or above 100 cm², so a percentile-based optimal band would have labelled people "optimal" who were already past the absolute at-risk cutoff. We kept the at-risk threshold in this age group, not because a high VAT means the same thing at 70 as at 40, but because flagging it prompts a more complete look at metabolic health in someone who may benefit from it. VAT simply carries less weight in that assessment for older adults.
| Age | Male optimal | Male normal | Female optimal | Female normal |
|---|---|---|---|---|
| 18–29 | < 22.3 | 22.3–100 | < 17.6 | 17.6–90 |
| 30–39 | < 39.5 | 39.5–100 | < 23.4 | 23.4–90 |
| 40–49 | < 63.9 | 63.9–100 | < 33.7 | 33.7–90 |
| 50–59 | < 84.0 | 84.0–100 | < 51.3 | 51.3–90 |
| 60+ | ≤ 100 | — | ≤ 90 | — |
All values in GE Lunar-equivalent cm².
There is no outcomes study that tells us the "ideal" VAT for a 35-year-old. The 25th percentile is our judgement call, made because lower VAT is generally associated with better outcomes and being in the leanest quarter for your age is an attainable target. The reference cohort published VAT as a mass in grams; we converted its percentile cutoffs to GE Lunar-equivalent area using published sex-specific relationships between VAT mass, volume and area, so the optimal values above are derived rather than read directly from the paper. We also note that people of South Asian ancestry may carry cardiometabolic risk at lower VAT values (in the range of 60 to 80 cm²), which a single population threshold will not capture.
Appendicular lean mass index (ALMI)
ALMI is the lean mass in your arms and legs divided by your height squared. It is the primary DEXA measure of skeletal muscle mass and the one used in the international diagnostic criteria for sarcopenia (low muscle mass and function).
How we classify it. Again a hybrid. The at-risk threshold is a fixed clinical cutoff, below 7.0 kg/m² for males and below 5.5 kg/m² for females, taken from the European Working Group on Sarcopenia in Older People (EWGSOP2) diagnostic criteria [6]. Those values sit roughly two standard deviations below the average for healthy young adults, and they apply at every age: the threshold for low muscle mass does not move as you get older; what changes is how many people fall below it. Note that a low ALMI on its own is not a diagnosis of sarcopenia, which also requires a measure of muscle strength or function.
The optimal threshold is age-banded at the 75th percentile of the reference cohort for your age and sex. Between the two sits the normal band.
| Age | Male optimal (kg/m²) | Female optimal (kg/m²) |
|---|---|---|
| 18–29 | > 9.04 | > 7.01 |
| 30–39 | > 9.24 | > 7.11 |
| 40–49 | > 9.17 | > 7.37 |
| 50–59 | > 9.17 | > 7.21 |
| 60–69 | > 8.87 | > 7.21 |
| 70+ | > 8.44 | > 7.31 |
We want to be transparent that "optimal" here means "in the top quarter for your age and sex", not "the amount of muscle proven to produce the best health outcomes". That evidence does not exist in a usable form. Higher muscle mass is generally associated with better outcomes, and the 75th percentile was chosen to balance that likely benefit against attainability.
A note on scanner differences. Published comparisons show that Hologic and GE Lunar also differ in how they measure lean mass in the limbs, and cross-calibration equations exist for this [1][2]. We have not yet applied one to ALMI. The available equations were derived from small studies (40 to 200 people) or older scanner models, and they operate on appendicular lean mass in kilograms rather than on the height-adjusted index that most clinic PDFs report, so applying them correctly requires additional data extraction and validation against our own members' scans. We are evaluating this.
In the meantime, the ALMI on your dashboard is the value from your PDF (or, where the PDF omits it, calculated from the arm and leg lean masses on it). Members scanned on Hologic machines should read their ALMI classification with that in mind. The direction of the difference matters here: Hologic systems tend to report less appendicular lean mass than GE Lunar systems, and where the NHANES BCA calibration is on, reported lean mass is lower again. Both effects push a Hologic member's ALMI down relative to our GE Lunar-based reference population, so if anything the classification errs toward under-crediting muscle mass rather than over-crediting it. A Hologic member sitting just below an optimal or at-risk boundary may genuinely be above it.
Bone mineral density (BMD)
A body composition DEXA reports total-body bone mineral density as a Z-score (compared to people your age and sex) and a T-score (compared to a healthy young adult of your sex). We show both.
Total-body BMD is not how osteoporosis is diagnosed. A diagnostic bone density scan images the lumbar spine and hip specifically (occasionally the forearm) and is interpreted by a radiologist against WHO criteria. A total-body BMD will likely read higher than a hip and spine BMD because it takes into account denser bones (e.g. the skull) and any fractures that have occurred over your lifetime. Your NiaHealth BMD result is a screening signal that can tell you whether that follow-up should be discussed, and it can signal whether or not your lifestyle is supporting your overall bone density.
Because it is a screening signal, we deliberately set a cautious flag. Both the Z-score and T-score are optimal above 0, normal between −1.0 and 0, and at-risk below −1.0. The −1.0 boundary is borrowed from the WHO classification used for diagnostic scans, where a T-score above −1.0 is defined as normal; we are not applying the WHO diagnostic categories to a total-body result, only using the same boundary as a sensible point to prompt a conversation.
The Z-score and the T-score answer different questions. The Z-score compares you with people of your own age and sex and is the appropriate comparison for premenopausal women and men under 50. The T-score compares you with a healthy young adult and is the score used clinically in postmenopausal women and men over 50, the groups in whom bone loss accelerates. We show both to everyone, but if you are younger than that, the Z-score is the one to pay attention to. Scanner manufacturers also use different reference databases to generate these scores, so you can expect a difference in the numbers between scanners. We apply the same cutoffs regardless of machine and note this limitation on the result.
Android/gynoid ratio and fat mass index
You will see two more fat-distribution numbers on your dashboard without a colour classification: the android/gynoid (A/G) ratio and the fat mass index (FMI). Both are shown for information only, with no optimal, normal or at-risk band.
Earlier versions of our dashboard did classify the A/G ratio. When we reviewed the evidence in 2026, we found that the commonly used A/G thresholds come from scanner manufacturer defaults and clinical convention rather than from prospective outcomes studies, and that VAT captures the fat-distribution risk story more directly and with better evidence behind it. So we removed the colour band rather than imply a level of certainty the literature does not support. FMI, similarly, adds little independent signal beyond body fat percentage and VAT, and thresholds linking it to outcomes are inconsistent across populations. We show the number so you can track it over time; we do not grade it.
The reference population, and why it isn't Canadian
Several of the classifications above depend on percentiles: where you sit relative to other people of your age and sex. That requires a reference population, and the one we use for ALMI and VAT is the Austrian LEAD cohort: 10,894 adults aged 18 to 81, recruited from the general population between 2011 and 2019 and scanned on GE Lunar Prodigy equipment, published in 2020 [7].
We would prefer to use Canadian data. It does not exist at the scale and quality we need. When we reviewed the alternatives, including US and other European datasets, none was clearly superior for a Canadian population, and switching cohorts partway would make your results this year incomparable with your results next year. LEAD is large, recent, population-based rather than drawn from a clinic, spans the full adult age range, reports ALMI directly, and was measured on the scanner family we convert VAT to. Its one inconvenience is that VAT was published as mass rather than area, which is why our VAT optimal thresholds are converted values (see above). On balance that combination made it the most defensible choice.
It is a European cohort, and Canada is more ethnically diverse than Austria. Percentile comparisons will fit some members better than others, and the South Asian VAT note above is one example of where a single population reference falls short.
We have committed internally to not revisiting these body composition decisions every time a marginally better-fitting dataset appears, or in response to individual queries. They will be reconsidered if a large, representative Canadian normative dataset is published, if a global consensus emerges on sarcopenia or VAT cutoffs, if all of our providers move to the same scanner type, or 18 months after the May 2026 review, whichever comes first. Stability is a feature: it means your trend line means something.
What this means for you
If your dashboard and PDF disagree, the most likely reasons are: (1) body fat percentage calculated with total mass instead of soft tissue mass (GE Lunar members, roughly one point lower), (2) reversal of the NHANES BCA calibration (members scanned at our Victoria and Vancouver clinic, two to three points lower and a lower fat mass in kilograms), (3) VAT converted from Hologic to GE Lunar equivalent (members scanned in Victoria or Vancouver), (4) VAT converted from grams or square inches to cm² (Edmonton members). Your lean mass, bone measurements and ALMI are the same in both places, and so is your fat mass unless you were scanned at that Victoria and Vancouver clinic.
If you want to track change over time, have your repeat scans done on the same machine, at the same clinic, in the same calibration mode where possible. Our standardization makes results more comparable across scanners, but nothing beats always using the same scanner.
Takeaways
- Different DEXA scanners produce different numbers for the same body. This is well documented and not a fault of any clinic.
- NiaHealth extracts the raw measurements from your PDF and applies one set of formulas and one set of thresholds to everyone, so your results are comparable to other members and to the published evidence.
- Body fat percentage is calculated against total body mass for everyone, and the NHANES BCA calibration adjustment is reversed for the one provider we have confirmed still uses it. VAT is converted to GE Lunar-equivalent cm² for everyone.
- ALMI is not yet cross-calibrated between manufacturers. For Hologic members the effect runs toward under-crediting muscle, not over-crediting it.
- Our at-risk thresholds are anchored to outcomes evidence and clinical guidelines.
- Where the evidence does not support a threshold (A/G ratio, FMI), we show the number and do not grade it.
- To track your progress accurately, upload your results to your NiaHealth Dashboard so we can standardize your data.
Our research standards & process
At NiaHealth, we do not make decisions first and look for evidence later. The entire process — from which tests we offer, to how we interpret results, to the recommendations we make — is grounded in clinical evidence from the ground up. Our research team is continually reviewing the literature to make sure the information we provide reflects current medical evidence. And frankly, we don’t think “trust us” should be the standard here. We think you should be able to see the process for yourself. Learn more here.