Reference intervals (RIs)
A reference interval (RI) provides an indication of where a test results falls in comparison to a reference population. RIs may also be referred to as 'reference ranges', although the term RI is most accurate as a 'range' is the difference between the top and bottom boundaries of an interval, whereas an 'interval' describes the boundaries themselves (e.g. if the RI for serum sodium is 133-145 mmol/L, the range would be 12 mmol/L [145-133=12]) (Haeckel et al., 2020). RIs were also historically referred to as 'normal ranges' although use of this term is now formally discouraged by the International Federation of Clinical Chemistry (Ozarda et al., 2018). Population-based RIs are not necessarily 'normal' or optimal in terms of health (e.g. the majority of North American adults have a BMI >25 kg/m2, although the risk of adverse health outcomes is lowest for a BMI between 18.5 and 25 kg/m2). Additionally, being classified as 'abnormal' has the potential to cause unnecessary emotional distress (Timbrell, 2024). As the terms 'reference range' and 'normal range' remain better understood than 'reference interval' among much of the general population, NiaHealth does continue to use this terminology, particularly in user-facing communication.
In clinical biochemistry, RIs are typically determined by testing at least 120 healthy individuals in a given age group, gender, and ethnicity. The central 95% of values (approximately 2 standard deviations on either side of the mean) is usually adopted as the RI (Doles et al., 2025). There is no underlying evidence that the central 95% is the best interval to use, and in some cases, particularly where the prevalence of the disease or risk factor detected by a test is low, a wider RI (e.g. central 99% of values) is adopted. It has been recommended that laboratories engaged in wellness testing have wider reference intervals (i.e. central 99% versus 95%) than hospital laboratories given that they are predominantly testing healthy individuals and are therefore more prone to false-positive results (El-Khoury et al., 2024).
For non-laboratory metrics (such as measures of body composition), reference standards or normative ranges are typically determined by testing a population sample (no guidance exists in terms of sample size) in a given age group, gender and ethnicity; results are typically presented as percentiles. While the boundaries of RIs varies in these situations (there is no specific guidance as with laboratory tests), having a RI that encompasses the central 95% of values is not uncommon. In some cases, such as bone mineral density, results are reported as Z-scores (i.e. how far the result is from the mean of the reference population, in terms of standard deviation), although this format is unfamiliar to many clinicians and patients and may lead to difficulties with interpretation.
While RIs offer a standard against which an individual's results can be compared, they have a number of potential pitfalls and limitations. First, by definition, the established practice of developing RIs labels 5% of healthy individuals as having results that are outside of the reference interval or 'abnormal' (Doles et al., 2025). Furthermore, for individuals having several tests, the higher number of tests required, the higher probability that one or more will be abnormal (El-Khoury et al., 2024).
Second, when data used to develop a RI do not fall into a gaussian distribution, transformed or non-parametric methods must be used to determine the RI; the use of different methods to establish RIs in these situations can lead to differing results.
Third, RIs should ideally be derived from a “healthy” group of the same age, same gender, same ethnicity and with similar co-morbidities than the population that is undergoing testing. However, in practice, this is not often done as it is expensive, time-consuming and logistically challenging, and many metrics do not have separate age-, gender- or ethnicity-specific ranges even though these factors are known to impact results. A comparison of 50 common tests among self-identified races and ethnicities identified differences in measurements between races and ethnicities for over half of these tests, only one of which had established ethnicity-specific reference ranges (Doles et al., 2025).
Fourth, while RIs should ideally be specific to the lab where the testing is being done, this is not always the case in practice. Although validated laboratories are required to undergo periodic assessment of accuracy, variation of 35% from a central validation lab is accepted by the College of American Pathologists for analytes such as creatinine and TSH, with variation of >65% being accepted for other analytes. The rationale for this is that the within-lab variability of repeat testing is expected to be much narrower than the between-lab variability.
Fifth, RIs do not necessarily reflect the range of results that are associated with optimal health outcomes. For example, in the case of BMI, a North American adult with a BMI of 30 kg/m2 would be expected to fall within the population reference interval, although BMI >25 kg/m2 has consistently been associated with adverse health outcomes. Similarly, it is possible that participants recruited for RI development are not actually “healthy” and are rather in a preclinical state. This is particularly common when considering RIs for nutritional factors (such as vitamin D and vitamin B12) when the reference population has a high prevalence of deficiency. Additionally, risk may vary within a RI, meaning that an individual at the bottom of an RI could have a meaningfully different risk of an outcome as an individual at the top of the RI (Ozarda et al., 2018).
Rather than independently developing their RIs using the method outlined above, labs may verify reference intervals provided by assay manufacturers using in-house studies with smaller sample sizes (i.e. 20). Alternately, they may base RIs on published data, although the analytical methods or population used to establish the ranges may differ greatly. Another alternative to the standard method of establishing RIs is the indirect approach, also known as the 'data mining' approach, which uses patient data already collected and stored in a lab databases to establish RIs. Machine learning and complex statistical algorithms can be used to exclude unhealthy participants and establish RIs. All of these alternate methods currently have many of the same limitations of the traditional method for RI determination.
Summary of RIs
RIs represent the interval in which a 'healthy' individual's test result is statistically most likely to fall. Clinical applicability of RIs require that they be established using samples from healthy individuals that are representative of the population to be tested (e.g. same age, gender, ethnicity), which is not always possible. RIs may be used as a guide to help in making medical decisions, but in most cases should not be used as an absolute indicator of health or disease.
Clinical decision limits (CDLs)
Another way to classify results is according to clinical decision limits (CDLs), also known as 'risk thresholds' or 'decision thresholds'. Where RIs provide a comparison to a reference population, CDLs relate results to clinical outcomes. Said another way, CDLs are based on the distribution of test results (or risk factors) in both the normal and diseased population, while RIs are based entirely on test results in the normal population.
CDLs usually involve a 'limit' or 'threshold' with different patient pathways on either side. For example, a CDL may differentiate between persons with and without a specific disease, or between those who do not need to be investigated further and those who do (Ceriotti & Henny, 2008). There can be several decision limits according to the likelihood of various clinical situations or different clinical questions. For example, different CDLs for HbA1c have been established for the diagnosis of prediabetes and diabetes, and different CDLs for hemoglobin exist for diagnosing anemia (e.g. hemoglobin <130 g/L in men and <120 g/L in nonpregnant women) versus for considering a blood transfusion (e.g. hemoglobin 70–80 g/L).
CDLs are typically established via clinical outcome studies and communicated via published guidelines. CDLs do not exist for every test, as relevant data are not always available to establish them. Examples of tests for which CDLs exist and are recommended rather than RIs include: total cholesterol, LDL-C, HDL-C, non-HDL-cholesterol (non-HDL-C), triglycerides, apolipoprotein A (Apo A), apolipoprotein B (Apo B) and HbA1c.
A number of strategies exist for setting CDLs, described below (also summarized in (Habibzadeh et al., 2016)):
Receiver operating characteristic (ROC) curve approach
The ROC approach determines CDLs based on test sensitivity and specificity. As shown below, a ROC curve is a plot of the false positive rate (1-specificity) against the true positive rate (sensitivity). A specific test has a low rate of false positives, and a sensitive test has a low rate of false negatives. In a perfect test, both sensitivity and specificity will be 1, and the ROC curve will travel directly up the y-axis and across the top of the graph. On the other hand, a test that is not good at discriminating between individuals with and without an outcome will have a ROC curve that bisects the plane of the graph. The area under the curve (AUC) is an index that can be calculated to determine the discriminating ability of the test. An AUC of 0.5 indicates an uninformative test (i.e. no better than a coin toss) while an AUC of 1.0 indicates optimal sensitivity and specificity. AUC can be helpful for comparing two different tests, with a higher AUC indicating better test characteristics.
Most tests do not have an AUC of 1.0, and choice of a CDL or cutoff must be informed by the clinical scenario and whether optimizing sensitivity and specificity are equally important or whether one should be optimized at the expense of the other. If they are deemed equally important, a cutoff where sensitivity=specificity may be appropriate. Cutoffs that maximize sensitivity + specificity are also used (this approach also maximizes Youden's index, which is equal to sensitivity + specificity - 1). These methods assume that there is no difference in risk or cost between a false positive and a false negative result and do not consider the pre-test probability of the disease in question.
Alternately, CDLs can be set to minimize false positives (e.g. maximize specificity at the expense of sensitivity) or minimize false negatives (e.g. maximize sensitivity at the expense of specificity). These choices will depend on the clinical context. In a screening situation where it is important not to miss any cases but false positives can be tolerated without excessive cost or risk, sensitivity is typically maximized. In a diagnostic situation where the risk of exposing a false positive individual to unnecessary testing and/or intervention outweighs the risk of a false negative, specificity is often maximized.
Bayesian approach
The Bayesian approach integrates the pre-test probability of the relevant disease (or outcome), the clinical sensitivity and specificity of the test, as well as the potential harms of diagnosing and/or treating people who don't have the disease and the net benefit of diagnosing and/or treating those who do have the disease. For example, the CDL for a troponin test result in a person with chest pain takes into account the pre-test probability of acute coronary syndrome versus alternate causes, the test characteristics, and the clinical costs of misclassification. As pre-test probability of disease and costs incurred by misdiagnosis vary between populations, cutoffs established with the Bayesian approach are not universal and separate CDLs should be determined for each region and outcome of relevance. While the Bayesian approach is considered the most evidence-based way to determine CDLs, its use in clinical practice is limited by the information required, and by lack of generalizability (Ozarda et al., 2018).
Epidemiological approach
This approach is primarily based on the results of population studies that demonstrated a different clinical outcome or risk of a clinical outcome (e.g. development of disease, cardiovascular event, mortality) for individuals with test results above and below the limit. The precise choice of number is typically arbitrary, given that risk typically occurs on a continuum. CDLs established using the epidemiological approach are typically defined during consensus conferences or based on recommendations from clinical practice guidelines. Guidelines for lipid levels and diabetes-related parameters incorporate CDLs established with the epidemiological approach (Ozarda et al., 2018).
Physiopathological approach
This approach involves the use of 'critical' or 'panic' values, where the result indicates a life-threatening condition that requires prompt intervention (e.g. severe hyponatremia). CDLs developed using this approach are often based on clinical experience, without the support of any statistical methods.
Summary of CDLs
CDLs are clinical thresholds aiming to differentiate between individuals with or at risk of a health condition and individuals who do not have the condition and/or are not at risk. There are a number of approaches for setting CDLs which take into account a combination of test characteristics, epidemiologic data, pre-test probability of the health condition, and consequences of misclassification. The CDLs recommended in clinical practice guidelines are often developed using an epidemiologic approach, which is both generalizable and pragmatic albeit not as evidence-based as a Bayesian approach. A single measure of health (such as HbA1c) may have different CDLs depending on the health outcome of interest and/or patient characteristics.
Additional considerations for setting results targets
In general, the use of CDLs based on clinical outcomes is recommended over the use of RIs based on biological variation (Ozarda et al., 2018). Regardless of how results targets are determined, the rationale behind any choice of interval or risk cutoff must be clearly explained.
It is also important that results targets take into account potential causes of biological variation, including age, gender, and ethnicity. Timing and condition of sample collection can also be a cause of variability (e.g. diurnal variation, effects of food intake), and different targets may be appropriate depending on collection conditions.
NiaHealth approach to setting results targets
Given that NiaHealth aims to be proactive about disease prevention, CDLs are prioritized in cases where adequate supporting evidence is available. In general, we use an epidemiologic approach to establishing targets, with incorporation of test characteristics and pre-test probability of the health outcome of interest where appropriate.
Our approach to evaluating the literature and setting targets is as follows:
- Define the test and the health outcome of interest
- Identify any established CDLs (e.g. clinical practice guidelines)
- Identify any high-quality literature (e.g. systematic reviews and meta-analyses) that provide evidence for setting a CDL
- Identify any RCTs or observational studies that provide evidence for setting a CDL
- Establish a CDL using the highest quality of available evidence
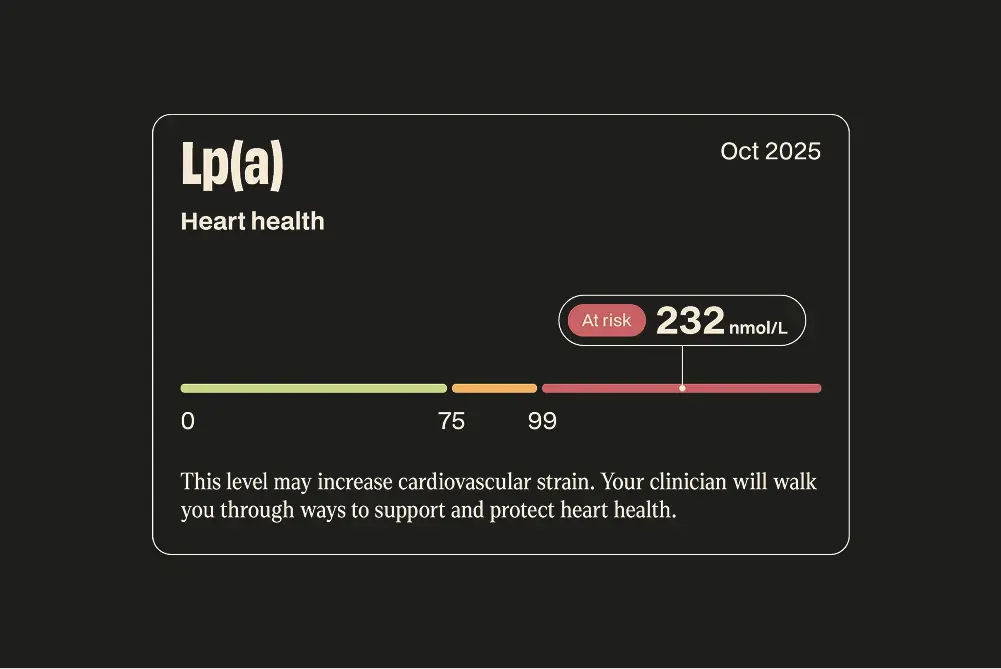
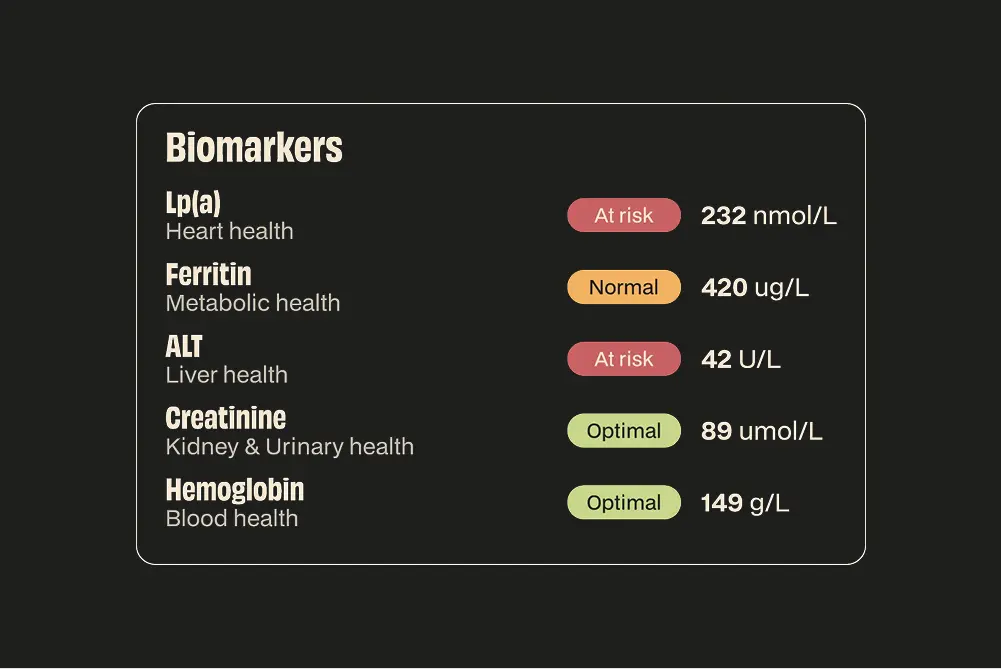
- Typically, this will include an 'optimal' range, at which no (or minimal) increased risk of disease is present, a 'normal' range, at which an individual may be on the continuum of risk, and an 'at risk' range, where an individual meets an established disease or risk cutoff
NiaHealth places a higher cost on missing an opportunity for proactive intervention than on obtaining a false positive result. The two-tier CDL scheme helps to harmonize these two possibilities, highlighting where the risk increase begins, but not typically flagging someone as being 'at risk' until they meet an established CDL. This approach empowers individuals in the 'normal' zone to intervene while aiming to minimize unnecessary health anxiety.
As NiaHealth is focused on maximizing longevity and healthspan and reducing morbidity and mortality for chronic disease, the following outcomes are typically prioritized when setting CDLs:
- Mortality
- Major Adverse Cardiovascular Events (MACE)
- Diabetes
- Cancer
- Neurologic disease
- Other components of metabolic syndrome: metabolic dysfunction-associated steatotic liver disease (MASLD), hypertension, insulin resistance
In some cases, a measure may be associated with risk of one of these outcomes, while also being used as a diagnostic measure for a different disease. For example, there is a positive association between TSH and mortality, even within the established reference interval for this analyte (Inoue et al., 2016), although existing intervals have been developed to aid with the diagnosis of hypothyroidism (TSH exceeding upper bound of interval) and hyperthyroidism (TSH below lower bound of interval) rather than for mortality prediction. In such cases, the interpretation notes that accompany the test result is clearly specifies which outcome the target refers to.
In cases where there is no data from clinical practice guidelines, systematic reviews, meta-analyses, RCTs, or large observational cohort studies to support the use of a CDL, lab-developed RIs are adopted. These are cross-referenced against existing data in the literature and discrepancies are resolved via consensus between the research and clinical teams, typically following discussion with the test provider.
The NiaHealth user dashboard specifies the rationale for our choice of target, and the relevant clinical outcomes.
Our research standards & process
At NiaHealth, we do not make decisions first and look for evidence later. The entire process — from which tests we offer, to how we interpret results, to the recommendations we make — is grounded in clinical evidence from the ground up. Our research team is continually reviewing the literature to make sure the information we provide reflects current medical evidence. And frankly, we don’t think “trust us” should be the standard here. We think you should be able to see the process for yourself. Learn more here.